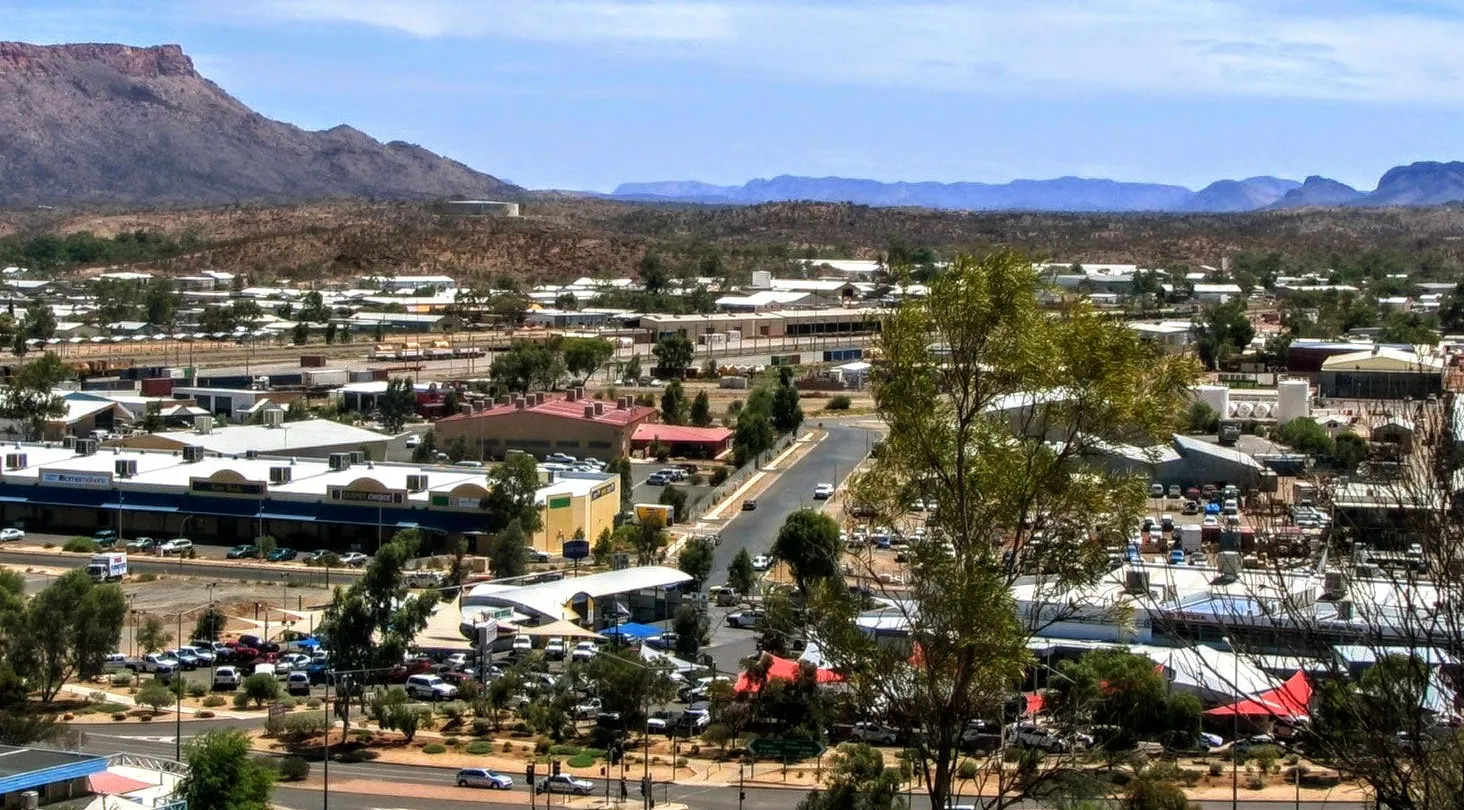
Crime and Pollution in Yulara
The following data and statistics on crime, pollution, and overall safety in Yulara are derived from a combination of trusted public sources and insights gathered from user contributions.This comprehensive approach helps provide a balanced view of the city's crime rates, environmental concerns, air quality, and public safety. By aggregating information from government reports, environmental studies, and direct feedback from residents, we aim offer an up-to-date and thorough analysis of key factors impacting quality of life in Yulara.Crime Data in Yulara
Crime Perception and Concerns
In 2024, Yulara stands out with an exceptionally low crime rate, effectively at zero, indicating an unparalleled level of safety and security among its residents.
This anomaly in crime statistics positions Yulara as potentially one of the safest places, with no reported concerns about property or violent crimes.
Some notable concerns include:
- Property CrimesThere are no significant issues with property crimes in Yulara, making it a safe haven for residents and visitors alike. Concerns such as theft and burglary are practically non-existent.
- Drug-Related IssuesThere are no reported drug-related crimes in Yulara, suggesting effective community programs and law enforcement efforts in place.
- Violent CrimesWith no violent crimes reported, Yulara presents a reassuring environment for all, regardless of the time of day.
- Public SafetyResidents of Yulara feel completely secure both during the day and night, a testament to the uncommon safety levels in the area.
Crime Trends and Safety
- Rising Crime ConcernsThere are no rising concerns about crime in Yulara, reinforcing the perception of a stable and secure environment.
- Specific FearsUnique in its absence of crime, Yulara's lack of specific fears regarding racial or religious victimization highlights a harmonious community.
Crime Rankings


Pollution Data in Yulara
Air Quality and Pollution Levels
Yulara reports no significant pollution data for 2024, suggesting excellent air quality and environmental conditions.
The assessment of air quality remains neutral, indicating minimal concerns or particulates affecting residents.
- PM2.5 (Fine Particulate Matter)PM2.5 levels are reported as neutral, supporting the perception of clean and breathable air within Yulara.
- PM10 (Coarse Particulate Matter)PM10 readings are equally negligible, further confirming the low particulate matter presence in the area.
Waste and Noise Pollution
Yulara experiences no notable levels of noise or waste issues, reflecting an orderly and well-maintained environment.
Reliable waste management has contributed to Yulara's clean surroundings and pleasant livability.
- Garbage Disposal SatisfactionWith no dissatisfaction reported, Yulara maintains effective garbage disposal services, contributing to the area's cleanliness.
- Noise and Light PollutionNoise and light pollution are virtually non-existent, ensuring a peaceful atmosphere throughout Yulara.
Green Spaces and Water Quality
Yulara offers beautifully maintained green spaces, although current data does not highlight specifics, reflecting a likely positive perception by its residents.
Drinking water quality in Yulara is perceived as excellent, indicating ample access to clean and safe water sources.
- Green and Parks QualityThe quality of green spaces is implied to be good, providing residents with valuable recreational areas.
- Drinking Water QualityDrinking water in Yulara is highly accessible and clean, making it a crucial asset to the residents' quality of life.


