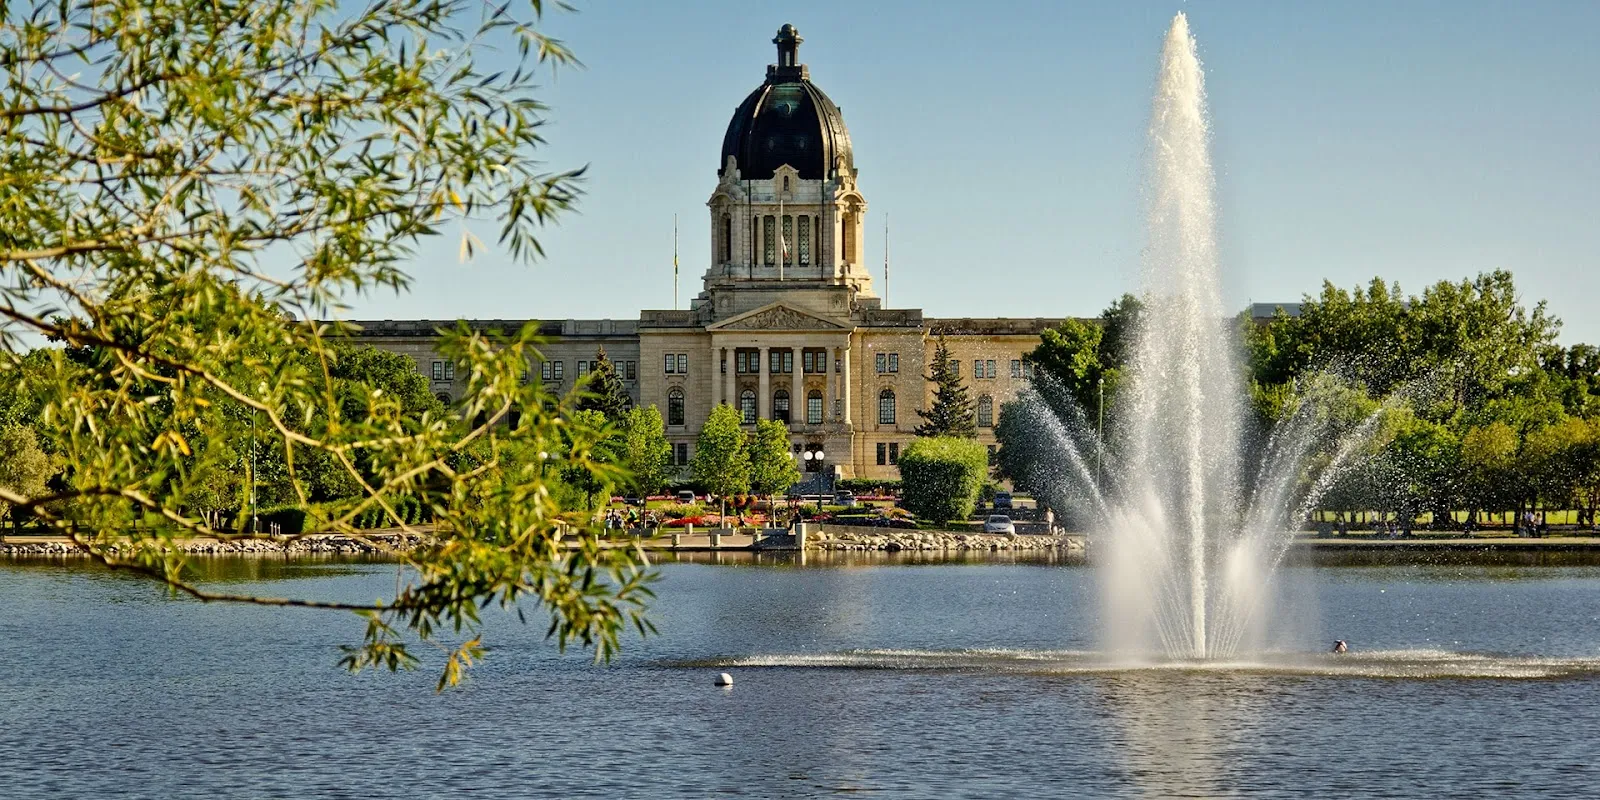
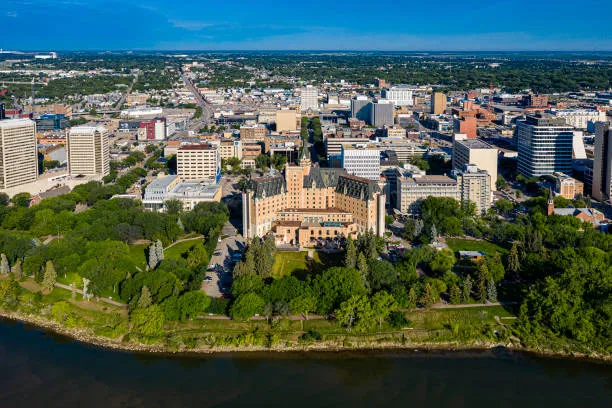
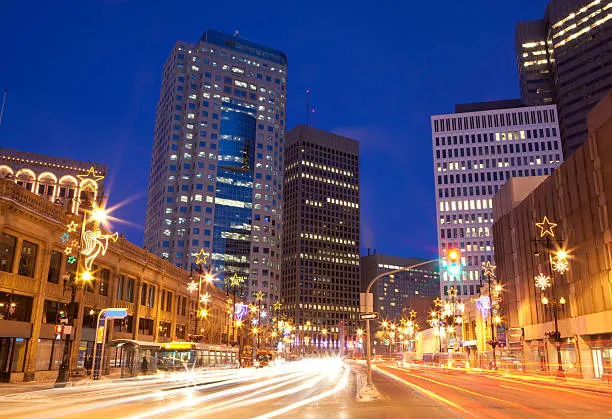
Crime and Pollution in Gander
The following data and statistics on crime, pollution, and overall safety in Gander are derived from a combination of trusted public sources and insights gathered from over 2 user contributions.This comprehensive approach helps provide a balanced view of the city's crime rates, environmental concerns, air quality, and public safety. By aggregating information from government reports, environmental studies, and direct feedback from residents, we aim offer an up-to-date and thorough analysis of key factors impacting quality of life in Gander.Crime Data in Gander
Crime Perception and Concerns
In 2024, Gander, Canada is perceived as one of the safest places. With exceptionally low crime rates, residents exhibit minimal concern over criminal activities.
The town offers a sense of security, as reflected by its high safety index, where residents feel exceptionally safe both during the day and at night.
Some notable concerns include:
- Property CrimesConcerns over property crimes in Gander are minimal. The town's low crime index suggests that incidents such as burglary and theft are rare, contributing to low public anxiety in this area.
- Drug-Related IssuesPublic perception toward drug-related issues is quite low. The community appears unaffected by drug-related crimes, shaping an environment perceived as safe and protected.
- Violent CrimesViolent crimes are notably absent from public concern in Gander. Residents express minimal fear of being mugged or physically assaulted, reinforcing the town's reputation for safety.
- Public SafetyResidents feel exceptionally safe throughout Gander in both daylight and nighttime. This perception of safety fosters a reassuring atmosphere in the community.
Crime Trends and Safety
- Rising Crime ConcernsDespite national trends, Gander residents do not perceive a rise in crime, maintaining a stable and secure living environment.
- Specific FearsResidents exhibit few specific fears regarding criminal activities, with very low anxiety about theft or violent behavior. This underscores Gander’s image as a safe community.
Crime Rankings


Pollution Data in Gander
Air Quality and Pollution Levels
Pollution data for Gander is presently unavailable for detailed assessment. However, there are no significant pollution issues reported, indicating a neutral stance on environmental quality.
Future updates on air quality metrics such as PM2.5 and PM10 will provide clearer insights, should data become available.
- PM2.5 (Fine Particulate Matter)Not enough data available
- PM10 (Coarse Particulate Matter)Not enough data available
Waste and Noise Pollution
Data regarding waste management and noise pollution in Gander is currently undetermined.
This neutral position suggests an absence of significant waste and noise concerns within the community, pending further details.
- Garbage Disposal SatisfactionNot enough data available
- Noise and Light PollutionNot enough data available
Green Spaces and Water Quality
The absence of data on green spaces and water quality indicates a need for further research. However, the lack of reported issues suggests a neutral environment in these aspects.
- Green and Parks QualityNot enough data available
- Drinking Water QualityNot enough data available