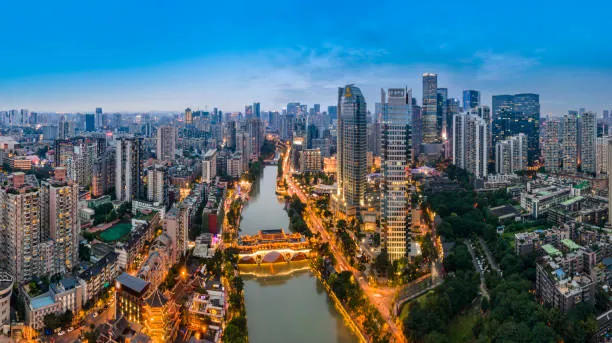
Crime and Pollution in Zhaotong
The following data and statistics on crime, pollution, and overall safety in Zhaotong are derived from a combination of trusted public sources and insights gathered from user contributions.This comprehensive approach helps provide a balanced view of the city's crime rates, environmental concerns, air quality, and public safety. By aggregating information from government reports, environmental studies, and direct feedback from residents, we aim offer an up-to-date and thorough analysis of key factors impacting quality of life in Zhaotong.Crime Data in Zhaotong
Crime Perception and Concerns
In 2024, Zhaotong presents a unique case in the realm of crime statistics with virtually no reported public sentiment towards various crime-related categories, suggesting either extremely low crime rates or a lack of available data.
The absence of reported worries and issues might indicate a potentially stable and safe environment, but it also highlights the need for more comprehensive data to ensure a complete understanding.
Some notable concerns include:
- Property CrimesNot enough data available
- Drug-Related IssuesNot enough data available
- Violent CrimesNot enough data available
- Public SafetyNot enough data available
Crime Trends and Safety
- Rising Crime ConcernsNot enough data available
- Specific FearsNot enough data available
Crime Rankings

Pollution Data in Zhaotong
Air Quality and Pollution Levels
In 2024, Zhaotong's pollution index suggests moderate pollution concerns, primarily due to levels of PM2.5 and PM10. These pollutants are typically a result of industrial activities and vehicular emissions.
Despite moderate pollution levels, there is a lack of perceivable change in public opinion regarding air quality, which calls for enhanced community engagement and environmental awareness.
- PM2.5 (Fine Particulate Matter)With a PM2.5 level of 24, the fine particulate matter in Zhaotong remains a health concern, particularly for sensitive groups including children and the elderly.
- PM10 (Coarse Particulate Matter)PM10 levels stand at 36, aligning with moderate pollution standards, yet hold implications for residents' long-term health, especially those with pre-existing respiratory conditions.
Waste and Noise Pollution
Waste management and noise pollution have not been extensively reported on in Zhaotong for 2024, indicating a gap in public perception data or suggesting that they are not pressing issues at this time.
Efforts to enhance garbage disposal satisfaction and reduce noise pollution should remain priorities should these areas become problematic.
- Garbage Disposal SatisfactionDue to the lack of reported data on garbage disposal satisfaction, it's unclear how residents perceive these services, yet it's critical to ensure effective systems are in place.
- Noise and Light PollutionThe absence of detailed feedback on noise and light pollution suggests that these may not be significant concerns, though ongoing monitoring is advisable.
Green Spaces and Water Quality
Zhaotong's available data does not reflect public sentiment regarding green spaces and water quality for 2024, indicating potential satisfaction or a need for improved engagement and reporting.
Despite the lack of detailed feedback, maintaining and improving green space quality and water accessibility can enhance livability in Zhaotong.
- Green and Parks QualityNot enough data available
- Drinking Water QualityNot enough data available