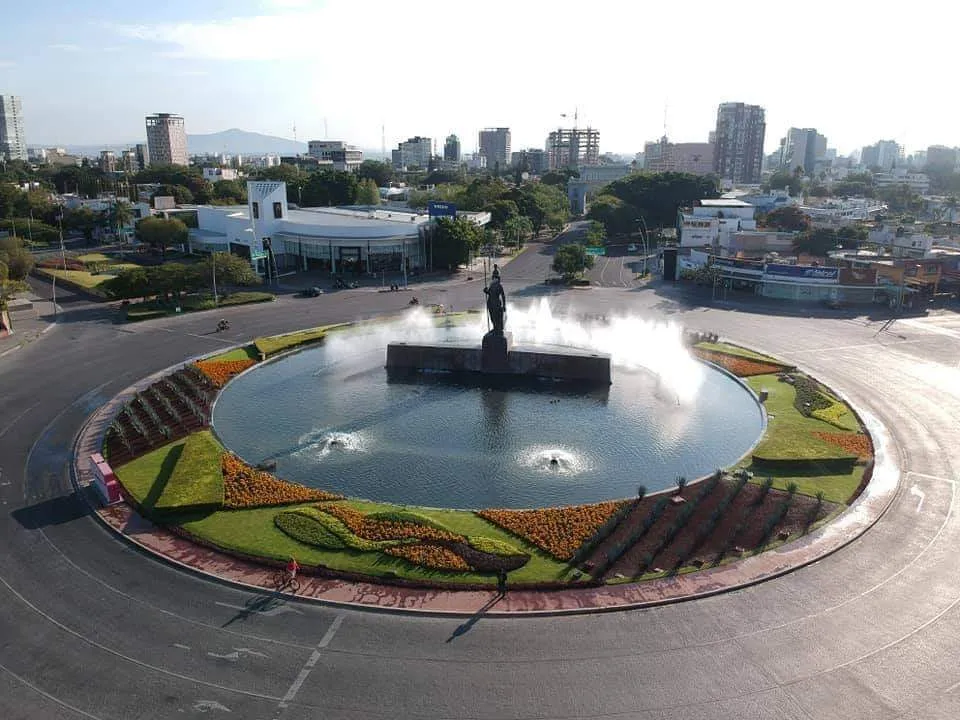
Traffic in Villahermosa
Villahermosa, Mexico, showcases a unique transportation landscape where walking and bus travel dominate the commuting scene.In 2024, the city faces challenges with CO2 emissions and traffic inefficiencies, but opportunities for improvement are evident.Average Commute Times
The average commute involves a mix of walking and bus travel, totaling around 34 minutes for a distance of 20.5 km.
- Bus - Bus commuters spend approximately 50 minutes on their journey, covering a distance of 40 km.
- Walking - Walking commuters typically spend 6 minutes covering a distance of 1 km.
Traffic Breakdown
Traffic Data
Overall average travel
Average when primarily using Bus
Average when primarily using Walking
More Information
Seasonal Trends
Traffic tends to increase during the rainy season, affecting bus schedules and walking conditions.
Holiday seasons see a rise in pedestrian traffic, particularly in commercial areas.
Commuter Pain Points
Long waiting times for buses can lead to extended commute durations.
Limited transportation options make it challenging for residents to choose eco-friendly alternatives.
Best Travel Times
Early mornings before 7 AM and late evenings after 7 PM are ideal for avoiding peak traffic.
Midday travel is generally smoother due to reduced commuter density.
Event Impacts
Public events and festivals often lead to road closures and increased traffic congestion.
Commuters are advised to plan ahead during major city events to avoid delays.
Sustainability Efforts
Villahermosa is exploring initiatives to expand green spaces and promote walking and cycling.
The city is investing in cleaner bus technologies to reduce its carbon footprint.
Ride-Sharing Impact
Ride-sharing services are gaining popularity, offering flexible commuting options.
These services help reduce the number of private vehicles on the road, easing congestion.