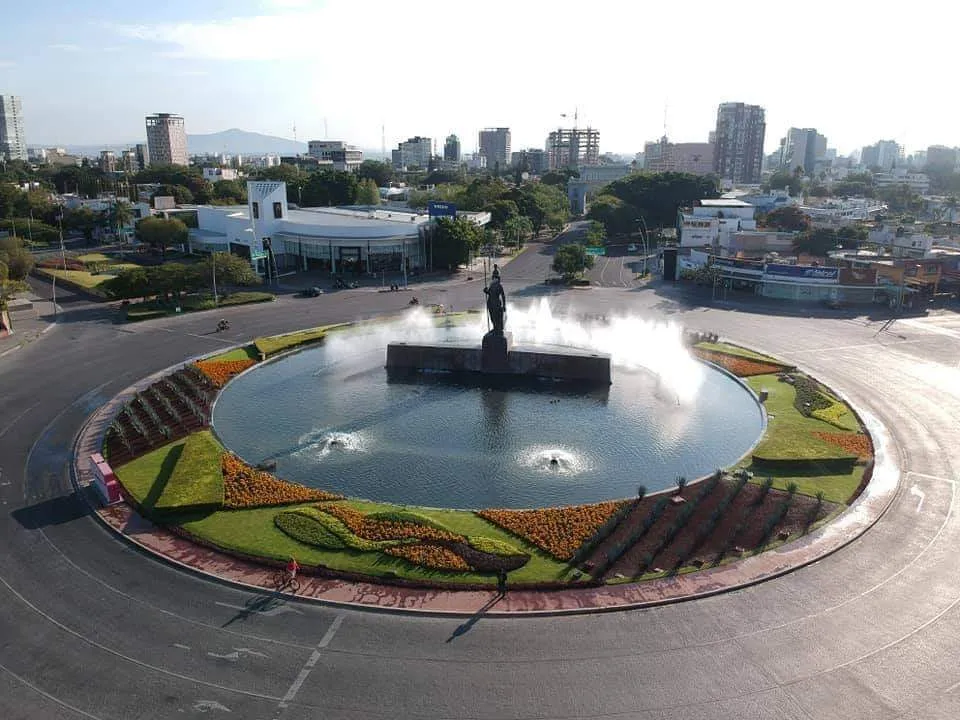
Traffic in Zapopan
In 2024, Zapopan's transportation landscape is dominated by cars, with 75% of commuters choosing this mode.Train travel accounts for 25% of the commuting methods, reflecting a significant reliance on public transport for longer distances.Average Commute Times
The average commute involves 3.75 minutes of waiting and 17.5 minutes of driving, covering a distance of 7.825 km.
- Car - Car commuters spend about 23.33 minutes driving over a distance of 7.1 km.
- Train - Train commuters experience 15 minutes of waiting and 25 minutes of travel, with an additional 15 minutes of walking, covering 10 km.
Traffic Breakdown
Traffic Data
Overall average travel
Average when primarily using Car
Average when primarily using Train
More Information
Seasonal Trends
Traffic congestion tends to increase during the rainy season due to road conditions.
Holiday seasons see a spike in car usage, leading to longer commute times.
Commuter Pain Points
High dependency on cars leads to frequent traffic jams, especially during peak hours.
Limited public transport options in certain areas increase reliance on personal vehicles.
Best Travel Times
Early mornings before 7 AM and late evenings after 8 PM are ideal for avoiding traffic.
Midday travel between 11 AM and 1 PM can also be less congested.
Event Impacts
Public events and festivals often lead to road closures and increased traffic congestion.
Sporting events in the city center can significantly impact traffic flow.
Sustainability Efforts
Zapopan is investing in expanding its train network to reduce car usage.
The city is promoting cycling and walking through improved infrastructure.
Ride-Sharing Impact
Ride-sharing services are helping to reduce the number of cars on the road.
These services provide a flexible alternative to public transport, especially in underserved areas.