Traffic in Winnipeg
Winnipeg's transportation landscape in 2024 is dominated by car usage, with a significant portion of the population relying on personal vehicles for their daily commutes.Public transportation, particularly buses, plays a crucial role in the city's commuting options, while walking and cycling are also notable modes of transport.Average Commute Times
The average commute involves 18.72 minutes of driving, with minimal waiting and walking times.
- Bus - Bus commuters spend approximately 34.27 minutes on the bus, with additional walking and waiting times.
- Car - Car users experience an average driving time of 25.68 minutes, with very little time spent walking.
- Walking - Walking commutes average 34 minutes, with some time spent waiting and minimal bus usage.
Traffic Breakdown
Traffic Data
Overall average travel
Average when primarily using Bus
Average when primarily using Car
Average when primarily using Walking
More Information
Seasonal Trends
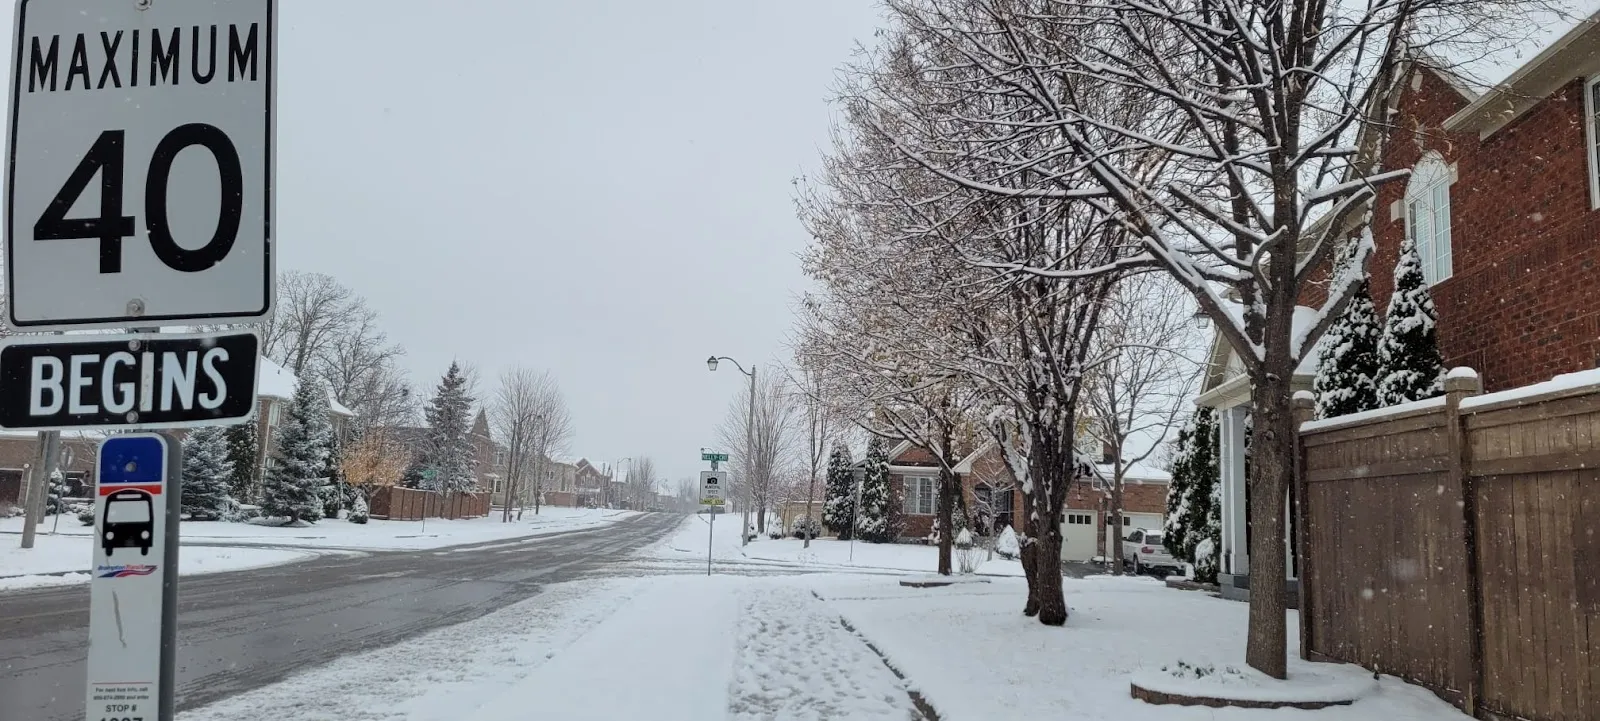
Winter months often see increased traffic delays due to snow and ice, affecting commute times.
Summer festivals and events can lead to temporary spikes in traffic congestion.
Commuter Pain Points
Traffic congestion during peak hours remains a significant challenge for Winnipeg commuters.
Limited public transport options in certain areas can lead to longer commute times.
Best Travel Times
Traveling outside of peak morning and evening hours can significantly reduce commute times.
Midday and late evening are generally less congested, offering smoother travel experiences.
Event Impacts
Major events at venues like the Canada Life Centre can cause localized traffic congestion.
Planning alternative routes during events can help avoid delays.
Sustainability Efforts
Winnipeg is investing in expanding its cycling infrastructure to promote eco-friendly commuting.
Public campaigns are encouraging carpooling and the use of public transport to reduce emissions.
Ride-Sharing Impact
Ride-sharing services are increasingly popular, offering flexible commuting options and reducing the need for personal car ownership.
These services help alleviate parking demand in busy areas, contributing to smoother traffic flow.