Traffic in Ottawa
Ottawa's transportation landscape in 2024 is dominated by car usage, with over half of the population commuting by car.Public transportation, including buses and trains, also plays a significant role, while walking and cycling are popular among a smaller segment of the population.Average Commute Times
The average commute involves about 14.6 minutes of driving and 2 minutes of waiting, covering a distance of 19.2 km.
- Bus - Bus commuters spend around 31.6 minutes on the bus, with additional waiting and walking time, covering 13.6 km.
- Car - Car commuters drive for approximately 27.8 minutes, with minimal walking, covering 24.3 km.
- Train - Train commuters spend about 15 minutes on the train and 8 minutes walking, covering 8 km.
- Walking - Walking commuters spend about 20.1 minutes walking, with a total commute time of 22.5 minutes, covering 2.98 km.
Traffic Breakdown
Traffic Data
Overall average travel
Average when primarily using Bus
Average when primarily using Car
Average when primarily using Train
Average when primarily using Walking
More Information
Seasonal Trends
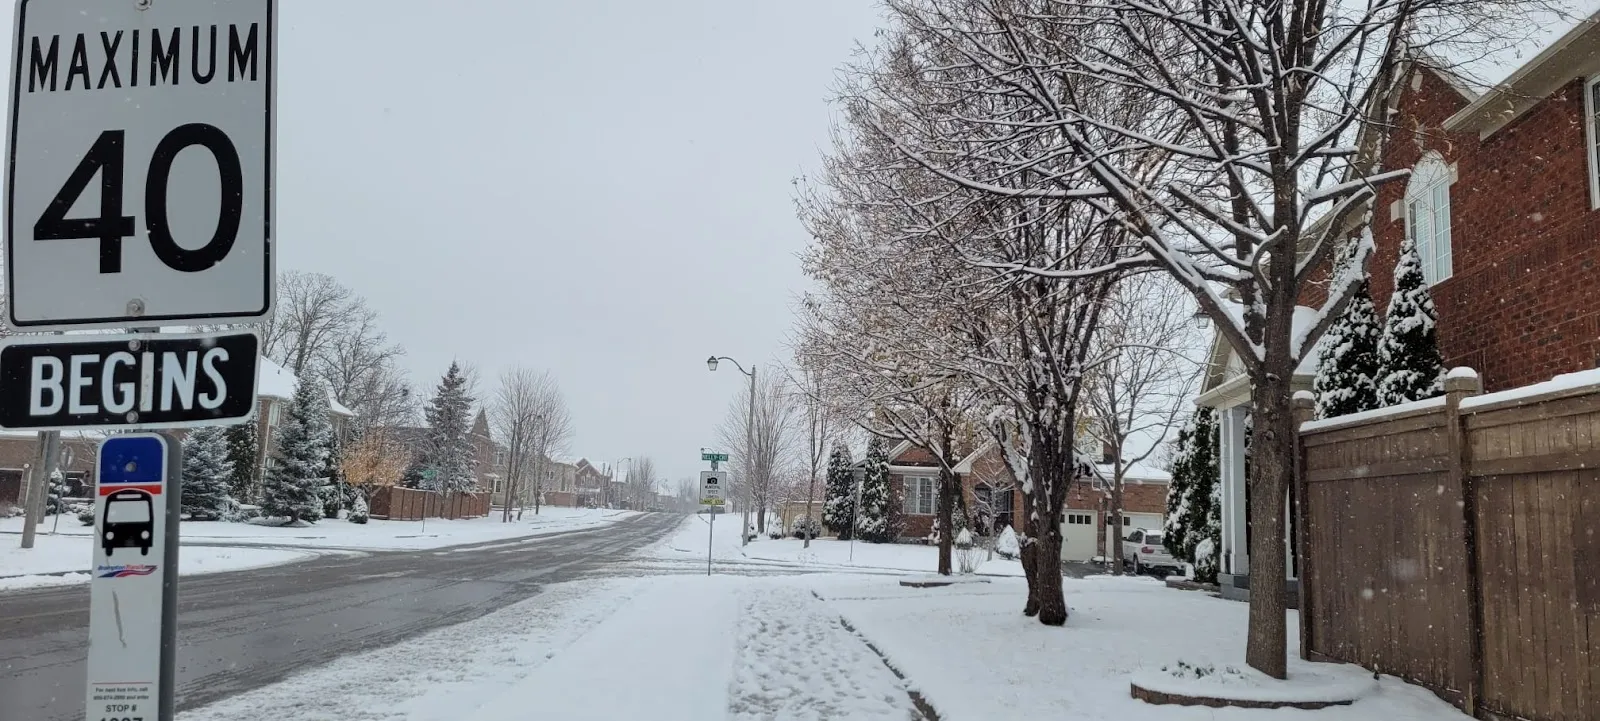
Winter months often see increased traffic delays due to snow and ice, impacting commute times.
Summer tends to have lighter traffic as many residents take vacations, reducing congestion.
Commuter Pain Points
Traffic congestion during peak hours remains a significant issue for car commuters.
Public transport reliability and frequency can be inconsistent, affecting commuter satisfaction.
Best Travel Times
Traveling outside of peak hours, such as mid-morning or early afternoon, can help avoid congestion.
Weekend mornings are generally less congested, providing smoother travel experiences.
Event Impacts
Major events like Canada Day celebrations significantly increase traffic, requiring road closures and diversions.
Sports events at TD Place Stadium can lead to localized congestion, especially in the evenings.
Sustainability Efforts
Ottawa is investing in expanding its light rail transit system to reduce car dependency.
The city promotes cycling through dedicated bike lanes and public awareness campaigns.
Ride-Sharing Impact
Ride-sharing services have reduced the need for personal car ownership, particularly among younger residents.
These services help alleviate parking demand in downtown areas, although they can contribute to congestion during peak times.