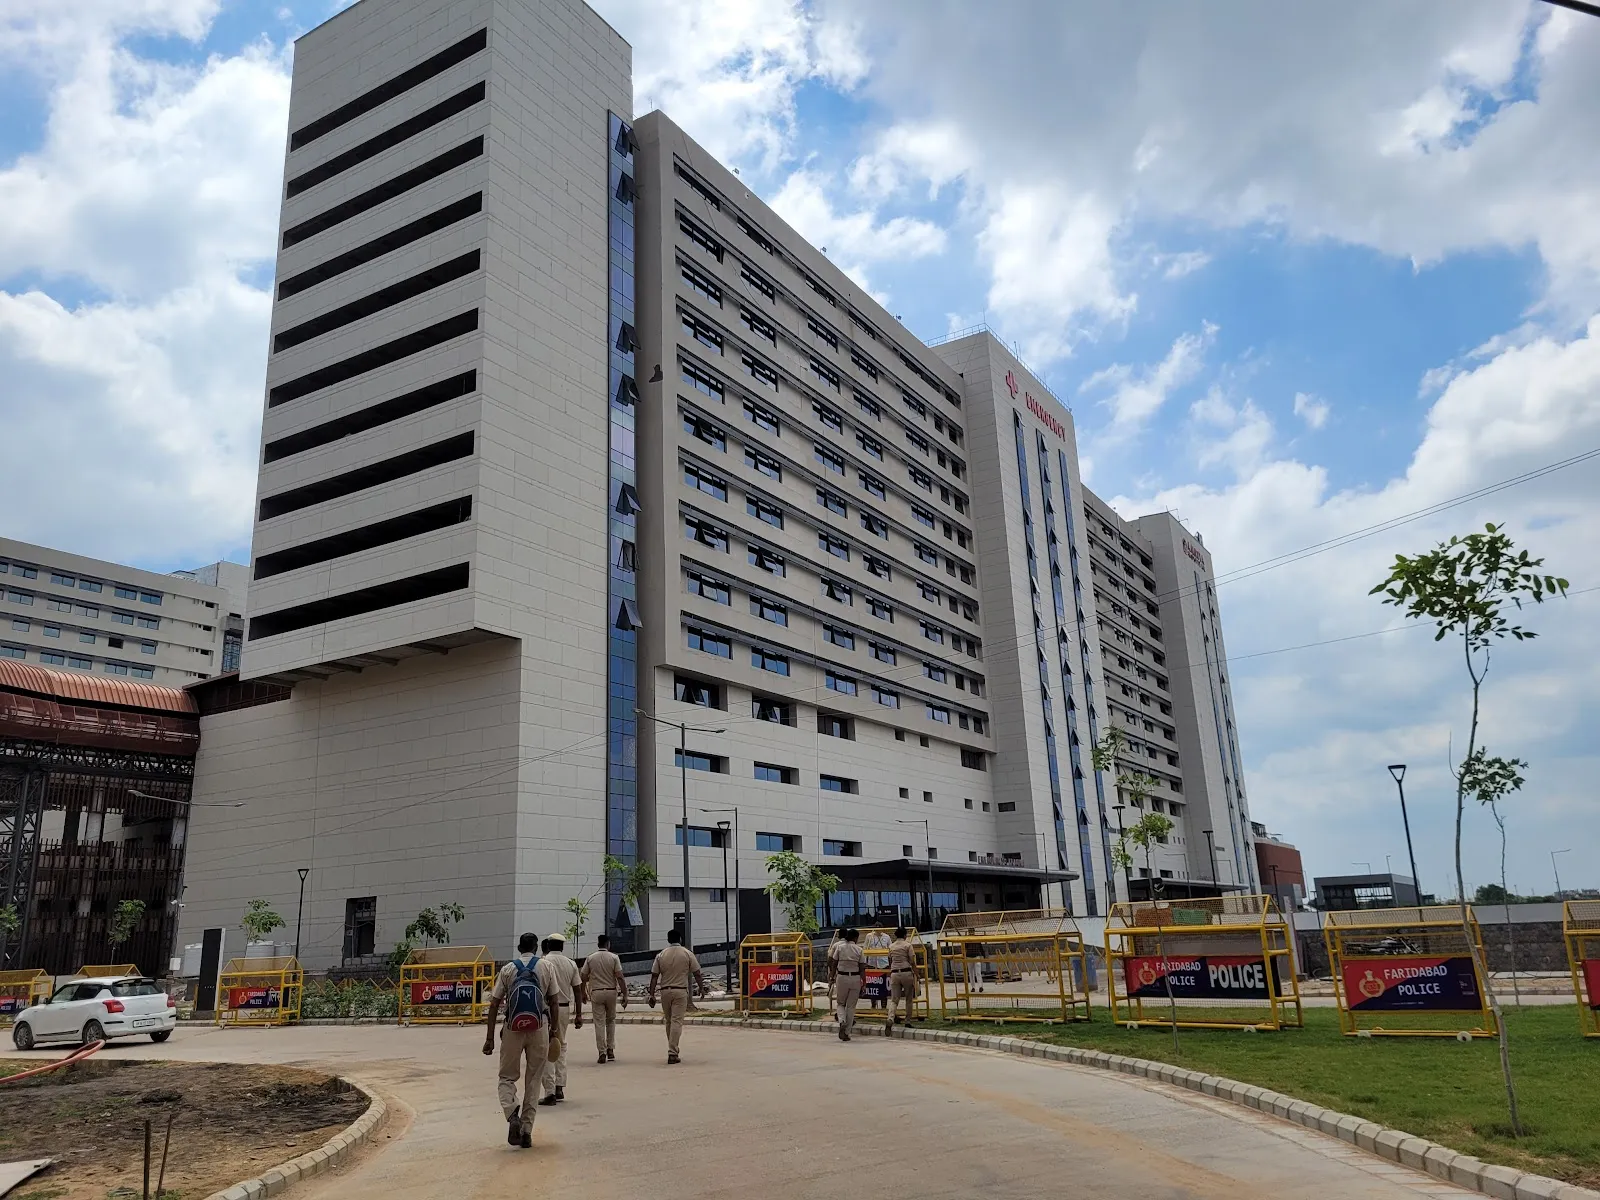
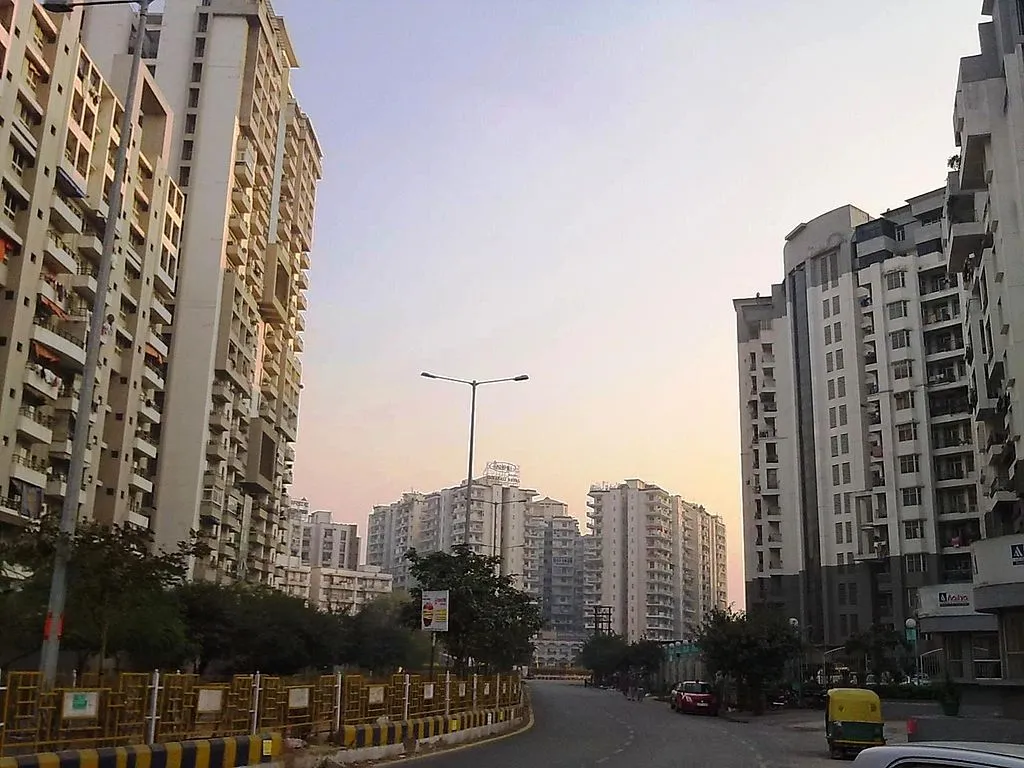
Crime and Pollution in Valsad
The following data and statistics on crime, pollution, and overall safety in Valsad are derived from a combination of trusted public sources and insights gathered from user contributions.This comprehensive approach helps provide a balanced view of the city's crime rates, environmental concerns, air quality, and public safety. By aggregating information from government reports, environmental studies, and direct feedback from residents, we aim offer an up-to-date and thorough analysis of key factors impacting quality of life in Valsad.Crime Data in Valsad
Crime Perception and Concerns
In 2024, Valsad presents an unusual case in crime statistics, with no available data indicating public perceptions of crime-related issues. This could suggest a safe environment, but also points to a lack of comprehensive data collection.
The absence of crime data across all categories makes it challenging to assess residents' true safety concerns. However, the lack of reported crimes could hint at an environment where crime rates may indeed be low or unreported.
Some notable concerns include:
- Property CrimesNot enough data available
- Drug-Related IssuesNot enough data available
- Violent CrimesNot enough data available
- Public SafetyNot enough data available
Crime Trends and Safety
- Rising Crime ConcernsNot enough data available
- Specific FearsNot enough data available
Crime Rankings


Pollution Data in Valsad
Air Quality and Pollution Levels
Valsad's pollution data offers more nuance, particularly with notable public perceptions in air and water quality. With a moderate pollution index, the city stands out for high satisfaction in certain environmental areas.
Residents express positive perceptions of air quality, with data indicating both public comfort in spending time outdoors and satisfaction with noise levels.
- PM2.5 (Fine Particulate Matter)Not enough data available
- PM10 (Coarse Particulate Matter)Not enough data available
Waste and Noise Pollution
- Garbage Disposal SatisfactionResidents of Valsad are notably satisfied with garbage disposal systems, reflecting efficient waste management practices in the city.
- Noise and Light PollutionNoise pollution is viewed positively, suggesting effective management of urban noise levels and contributing to an overall pleasant living environment.
Green Spaces and Water Quality
- Green and Parks QualityDespite excellent water quality, residents have voiced low satisfaction with green spaces, indicating a need for improvement in recreational and park facilities.
- Drinking Water QualityValsad excels in drinking water quality and accessibility, earning high marks from residents. This is a significant asset to the city’s livability and public health.