Traffic in Fort McMurray
In 2024, Fort McMurray's transportation landscape is dominated by car usage, with a significant portion of the population relying on personal vehicles for their daily commutes.Public transportation, particularly buses, also plays a crucial role, although it accounts for a smaller share of the commuting methods.Average Commute Times
The average commute involves 2.46 minutes of waiting and 35.62 minutes of driving, covering a distance of 40.95 km.
- Bus - Bus commuters spend an average of 10.67 minutes waiting and 13.67 minutes on the bus, with a total travel distance of 11.33 km.
- Car - Car users experience a driving time of 46.3 minutes, covering a distance of 49.83 km without any waiting time.
Traffic Breakdown
Traffic Data
Overall average travel
Average when primarily using Bus
Average when primarily using Car
More Information
Seasonal Trends
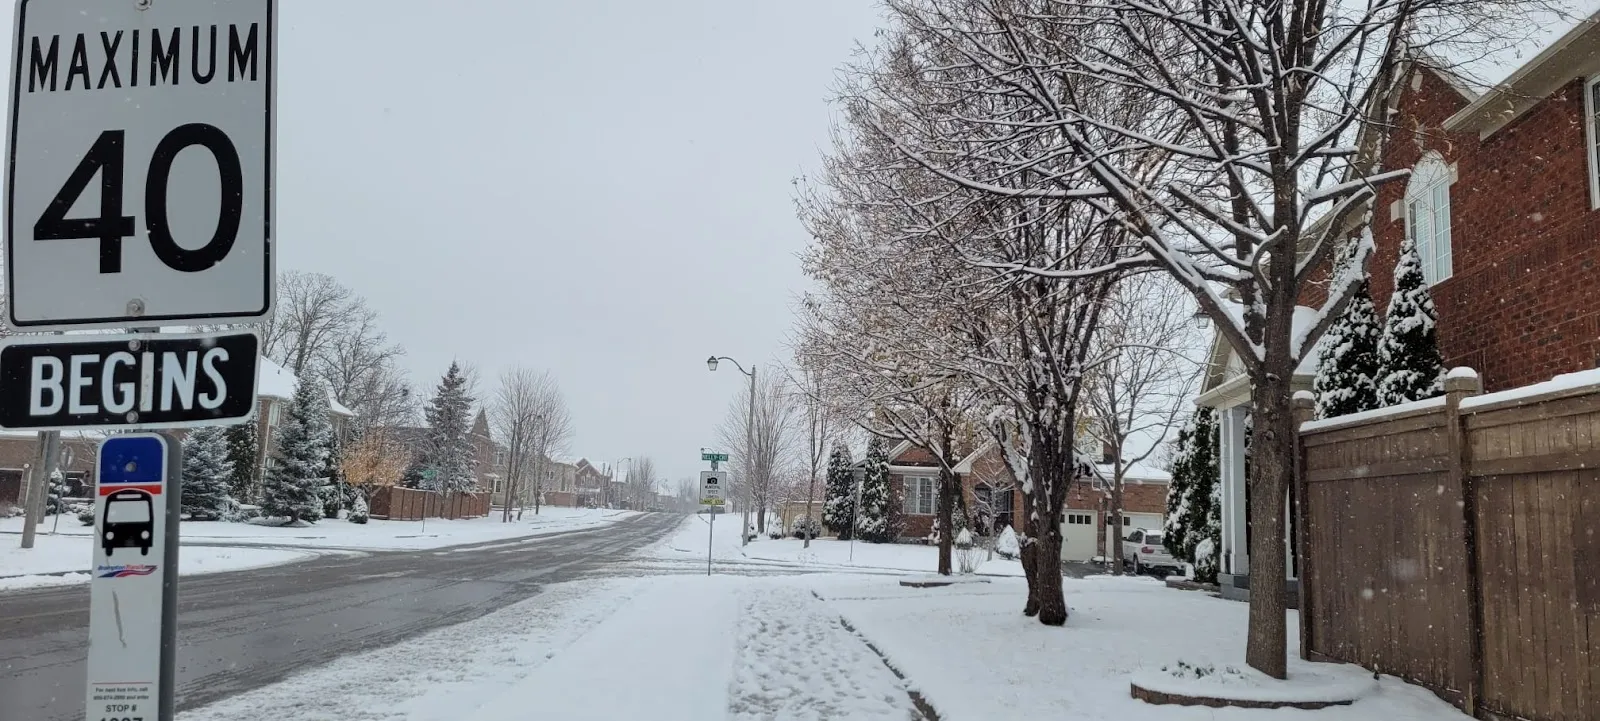
Winter months often see increased traffic delays due to snow and ice, affecting commute times.
Summer festivals and events can lead to temporary spikes in traffic congestion.
Commuter Pain Points
Long commute times for car users due to traffic congestion during peak hours.
Limited public transportation options outside of bus services, leading to reliance on cars.
Best Travel Times
Early mornings before 7 AM and late evenings after 7 PM are generally the best times to avoid heavy traffic.
Midday travel between 10 AM and 2 PM can also offer smoother commutes.
Event Impacts
Large public events, such as concerts and sports games, can significantly increase traffic congestion in the city center.
Planning alternative routes during these events can help mitigate delays.
Sustainability Efforts
The city is exploring initiatives to expand the public transit system and promote electric vehicle usage.
Community programs encouraging carpooling and ride-sharing aim to reduce the number of vehicles on the road.
Ride-Sharing Impact
Ride-sharing services have provided flexible transportation options, reducing the need for personal car ownership.
These services help alleviate parking demand in busy areas, contributing to smoother traffic flow.