Traffic in Hinton
In Hinton, Canada, the transportation landscape is dominated by car usage, with 100% of commuters relying on this mode of transport.This heavy reliance on cars contributes to significant CO2 emissions, highlighting the need for sustainable transportation solutions.Average Commute Times
The average commute time in Hinton is 6 minutes, with most of this time spent driving.
- Car - Car commuters in Hinton spend about 5 minutes driving, covering a distance of 6 kilometers.
Traffic Breakdown
Traffic Data
Overall average travel
Average when primarily using Car
More Information
Seasonal Trends
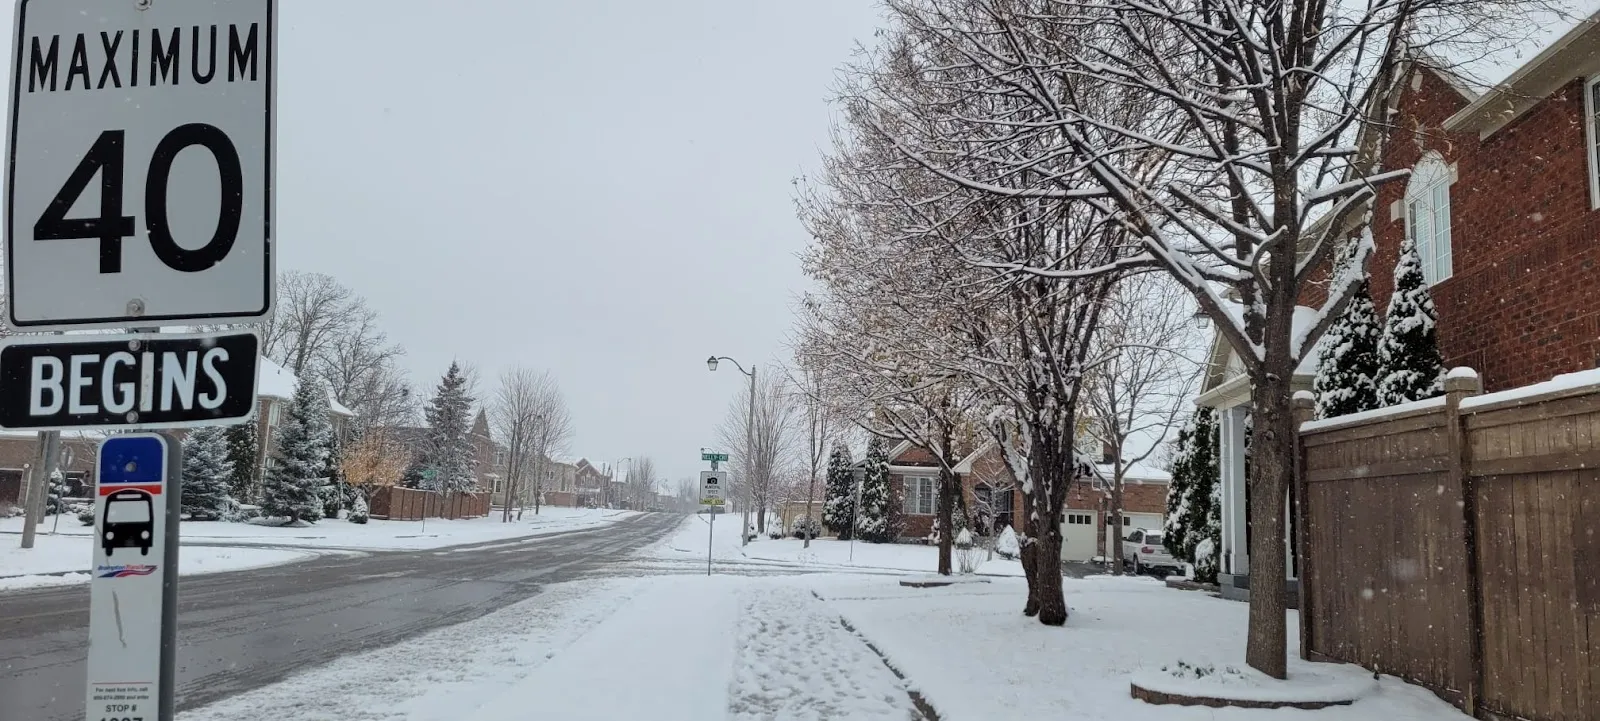
Winter months may see increased travel times due to snow and ice, affecting road conditions.
Summer tourism can lead to higher traffic volumes, particularly on weekends.
Commuter Pain Points
Limited public transportation options force reliance on cars, increasing traffic congestion.
Weather conditions in winter can make driving hazardous, impacting commute times.
Best Travel Times
Early mornings and late evenings are the best times to travel to avoid peak traffic.
Weekdays generally have less traffic compared to weekends during tourist season.
Event Impacts
Local festivals and events can significantly increase traffic, requiring road closures and detours.
Planning travel around these events can help avoid delays.
Sustainability Efforts
Hinton is exploring initiatives to promote electric vehicle use to reduce emissions.
Community programs encouraging carpooling are being considered to decrease traffic congestion.
Ride-Sharing Impact
Ride-sharing services are not widely used in Hinton, but they have the potential to reduce car dependency.
Increased adoption of ride-sharing could help alleviate parking issues and reduce traffic.