Traffic in North Bay
In 2024, North Bay's transportation landscape is dominated by walking and car usage, each accounting for 50% of the commuting methods.With a focus on sustainable travel, the city sees minimal reliance on public transport and bicycles, highlighting potential areas for development.Average Commute Times
The average commute involves 4 minutes of driving and 13.5 minutes of walking, covering a distance of approximately 3.93 km.
- Car - Car commuters spend about 5.5 minutes driving and 1 minute walking, covering a distance of 2.61 km.
- Walking - Walking commutes average 26 minutes, with a brief 2.5 minutes of driving, covering 5.25 km.
Traffic Breakdown
Traffic Data
Overall average travel
Average when primarily using Car
Average when primarily using Walking
More Information
Seasonal Trends
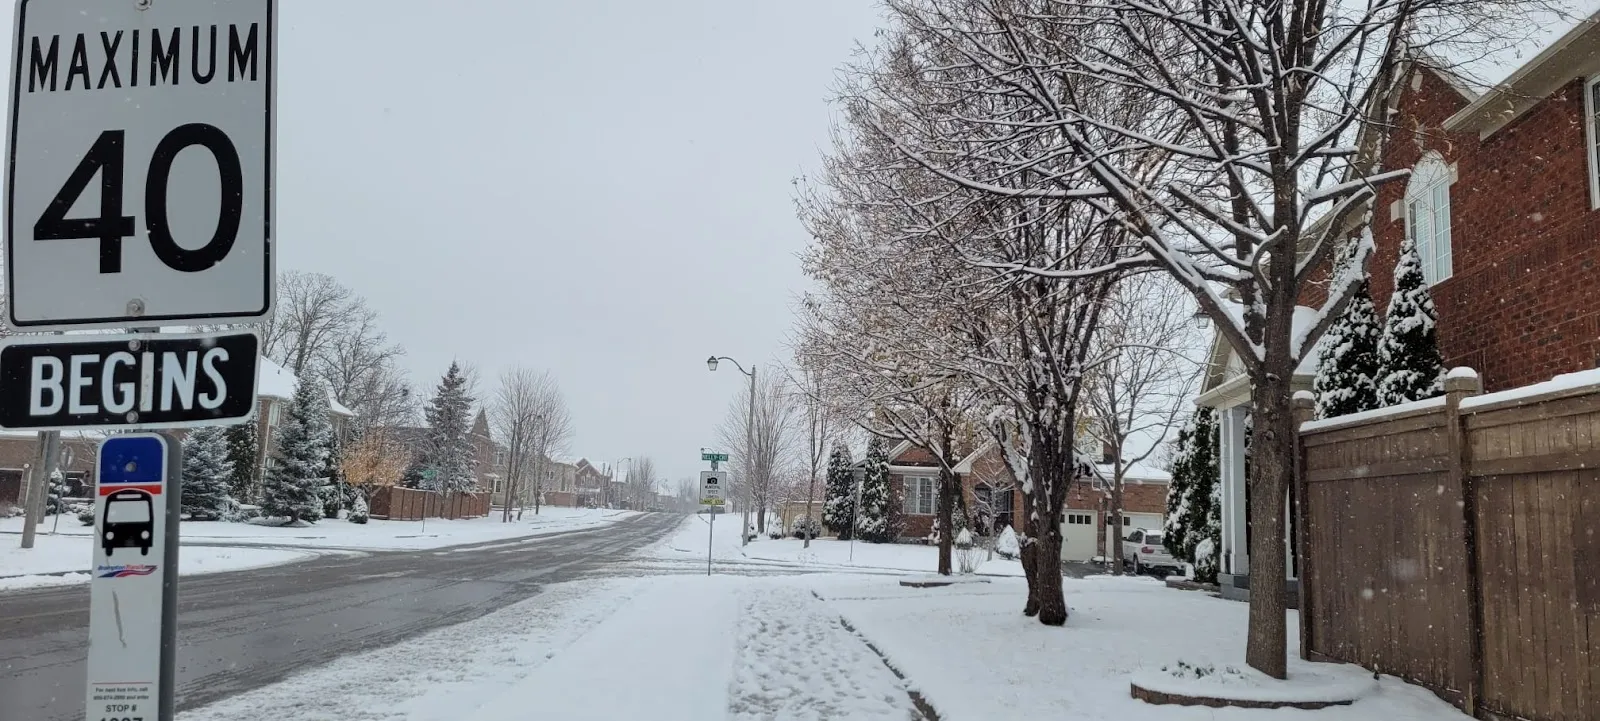
Winter months may see increased car usage due to harsh weather conditions, impacting walking commutes.
Summer typically encourages more walking and outdoor activities, potentially reducing car dependency.
Commuter Pain Points
Limited public transport options can lead to over-reliance on cars, increasing traffic congestion.
Pedestrian infrastructure may need improvements to support the high percentage of walking commuters.
Best Travel Times
Early mornings and late evenings are generally less congested, offering smoother commutes.
Midday travel can be optimal for avoiding peak traffic hours.
Event Impacts
Public events in North Bay can significantly affect traffic patterns, often leading to temporary congestion.
Planning travel around major events can help avoid delays.
Sustainability Efforts
North Bay is exploring initiatives to promote electric vehicles and enhance public transport networks.
Community programs encouraging walking and cycling aim to reduce the city's carbon footprint.
Ride-Sharing Impact
Ride-sharing services are gradually influencing commuting habits, offering flexible alternatives to car ownership.
These services can help reduce the number of vehicles on the road, easing congestion.