Traffic in Sault Ste. Marie
In 2024, Sault Ste. Marie sees a predominant use of cars for commuting, with 75% of the population relying on this mode of transport.Walking is the second most popular mode of transportation, accounting for 25% of commutes, reflecting the city's compact and pedestrian-friendly nature.Average Commute Times
The average commute time in Sault Ste. Marie is approximately 9 minutes, covering a distance of 7.95 km.
- Car - Car commuters spend about 10 minutes driving over a distance of 10.27 km.
- Walking - Walking commuters take around 4 minutes to cover a distance of 1 km.
Traffic Breakdown
Traffic Data
Overall average travel
Average when primarily using Car
Average when primarily using Walking
More Information
Seasonal Trends
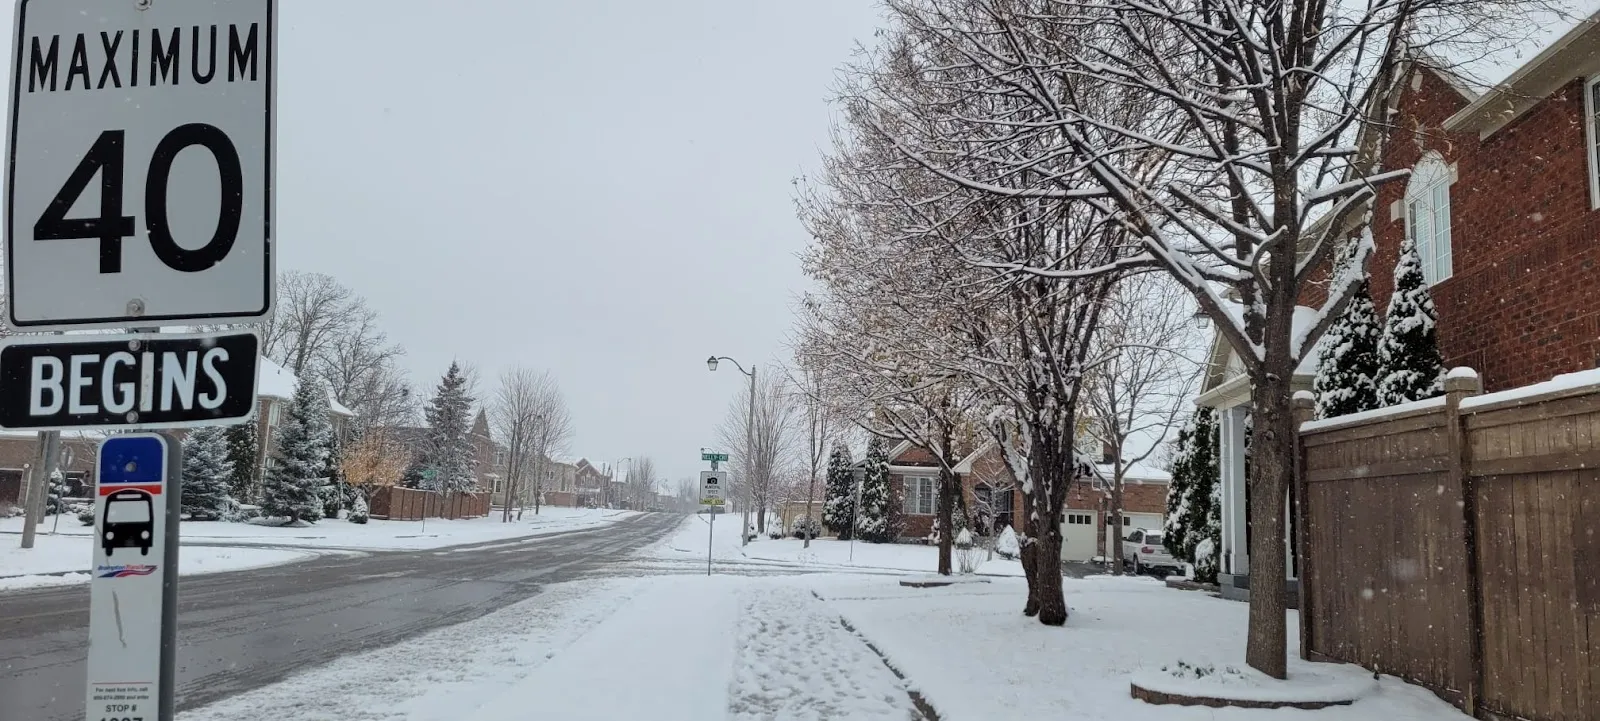
Winter months can lead to increased car usage due to harsh weather conditions, impacting commute times.
Summer sees a rise in walking and outdoor activities, slightly reducing car traffic.
Commuter Pain Points
Limited public transportation options may inconvenience those without access to a car.
Weather conditions can significantly affect commute times, especially during winter.
Best Travel Times
Early mornings and late evenings are ideal for avoiding peak traffic congestion.
Midday travel is generally smooth due to lower traffic volumes.
Event Impacts
Public events and festivals can lead to temporary road closures and increased traffic congestion.
Planning ahead for such events can help mitigate travel delays.
Sustainability Efforts
The city is exploring initiatives to expand cycling lanes and pedestrian pathways.
Efforts are underway to promote carpooling and reduce single-occupancy vehicle trips.
Ride-Sharing Impact
Ride-sharing services are gaining popularity, offering a flexible alternative to car ownership.
These services help reduce the number of cars on the road, contributing to lower emissions.