Traffic in Yorkton
In 2024, Yorkton's transportation landscape is dominated by car usage, with 100% of commuters relying on this mode.The average commute time for car users is approximately 7 minutes, reflecting the city's compact size and efficient road network.Average Commute Times
The average commute time across all modes is 7 minutes, primarily due to car usage.
- Car - Car users experience a 7-minute commute, covering an average distance of 4 kilometers.
Traffic Breakdown
Traffic Data
Overall average travel
Average when primarily using Car
More Information
Seasonal Trends
Traffic patterns in Yorkton remain relatively stable throughout the year due to the consistent use of cars.
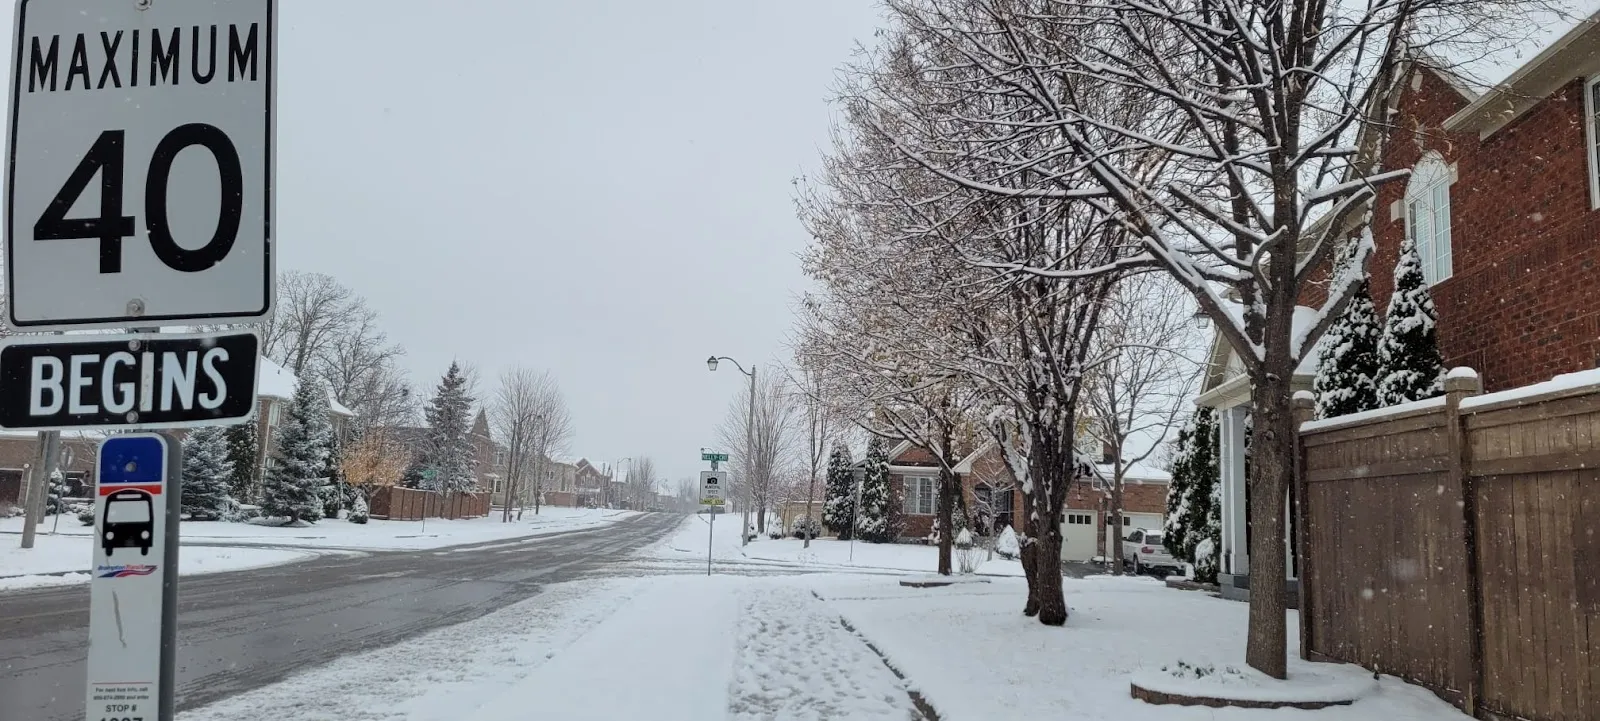
Winter conditions may slightly increase commute times due to snow and ice on roads.
Commuter Pain Points
Limited public transportation options force reliance on cars, increasing traffic congestion.
Winter weather can exacerbate driving conditions, leading to potential delays.
Best Travel Times
Early mornings and late evenings are optimal for travel to avoid any potential traffic buildup.
Midday travel is generally smooth due to lower traffic volumes.
Event Impacts
Local events can temporarily increase traffic, particularly around event venues.
Planning travel around major events can help avoid congestion.
Sustainability Efforts
Yorkton is exploring initiatives to promote cycling and walking to reduce car dependency.
Efforts to enhance public transportation could significantly lower the city's carbon footprint.
Ride-Sharing Impact
Ride-sharing services are slowly gaining traction, offering alternatives to car ownership.
These services could help reduce the number of vehicles on the road, easing traffic congestion.