Traffic in Haldimand County
In 2024, Haldimand County's transportation landscape is dominated by car usage, with 100% of commuters relying on this mode.The average commute time for drivers is approximately 49 minutes, reflecting the rural nature and spread-out geography of the area.Average Commute Times
The average commute time across all categories is 49 minutes, with a distance of 11 km.
- Car - Car commuters experience an average driving time of 49 minutes over a distance of 11 km.
Traffic Breakdown
Traffic Data
Overall average travel
Average when primarily using Car
More Information
Seasonal Trends
Traffic tends to increase during the summer months due to tourism and local events.
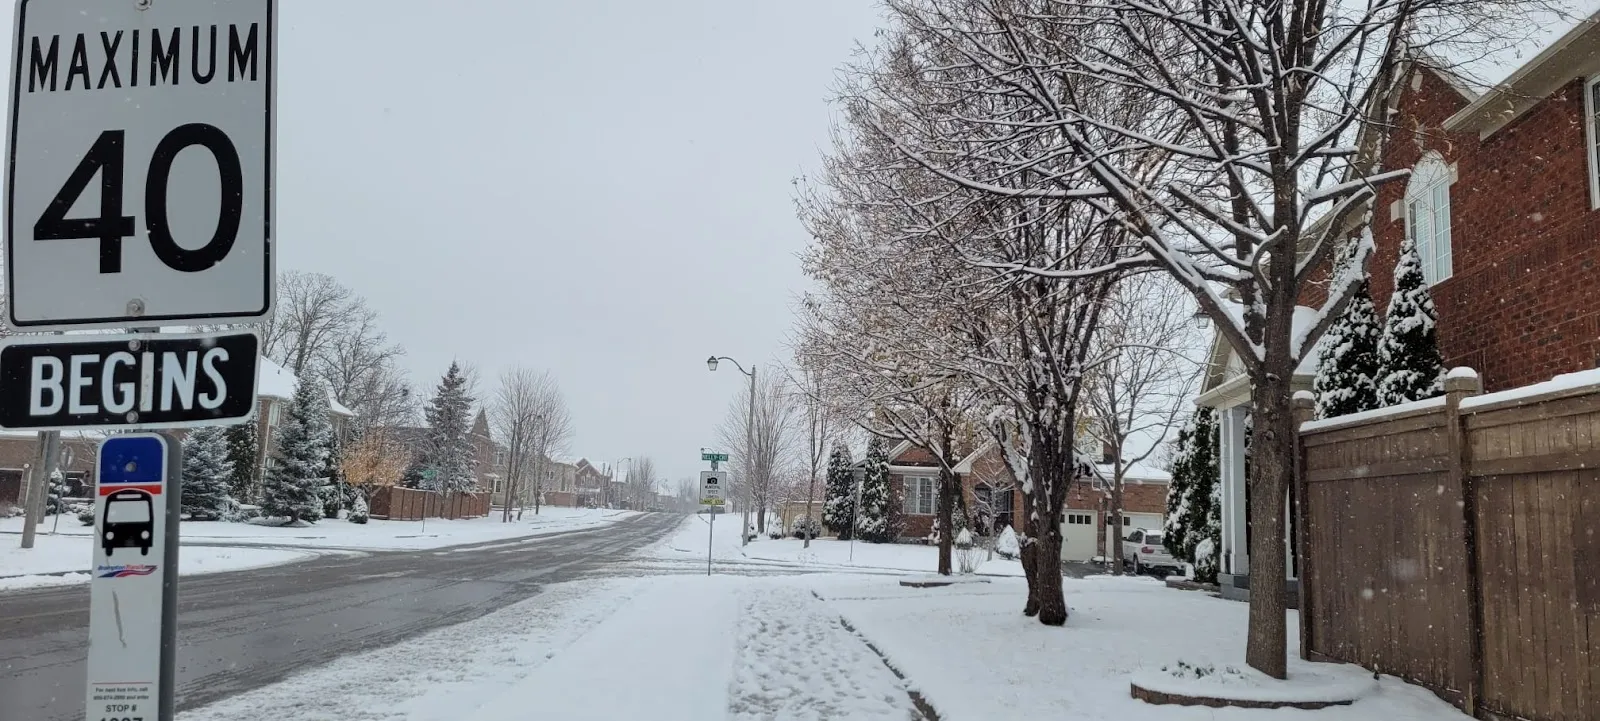
Winter conditions can lead to longer commute times due to snow and ice on the roads.
Commuter Pain Points
Limited public transportation options force reliance on personal vehicles.
Rural road conditions can deteriorate quickly, affecting travel times and safety.
Best Travel Times
Early morning and late evening are the best times to travel to avoid peak traffic.
Midday travel is generally smooth, with fewer vehicles on the road.
Event Impacts
Local festivals and agricultural fairs can significantly increase traffic congestion.
Planning routes around event schedules can help mitigate delays.
Sustainability Efforts
Haldimand County is exploring the introduction of electric vehicle charging stations.
Community initiatives are in place to promote carpooling and reduce single-occupancy vehicle trips.
Ride-Sharing Impact
Ride-sharing services are slowly gaining traction, offering alternatives to personal car use.
These services could help reduce the number of vehicles on the road, easing congestion.