Traffic in London
In 2024, London, Canada, sees a diverse range of transportation modes with cars being the predominant choice for commuters.The city's traffic data reveals significant insights into commute times and CO2 emissions, highlighting areas for potential improvement.Average Commute Times
The average commute involves 2.67 minutes waiting, 14.17 minutes driving, and covers a distance of 12.51 km.
- Bus - Bus commuters spend about 9.14 minutes waiting and 20.29 minutes on the bus, covering 6.47 km.
- Car - Car users drive for approximately 24.29 minutes over a distance of 17.06 km.
- Walking - Walking commutes average 25 minutes, covering a distance of 3 km.
Traffic Breakdown
Traffic Data
Overall average travel
Average when primarily using Bus
Average when primarily using Car
Average when primarily using Walking
More Information
Seasonal Trends
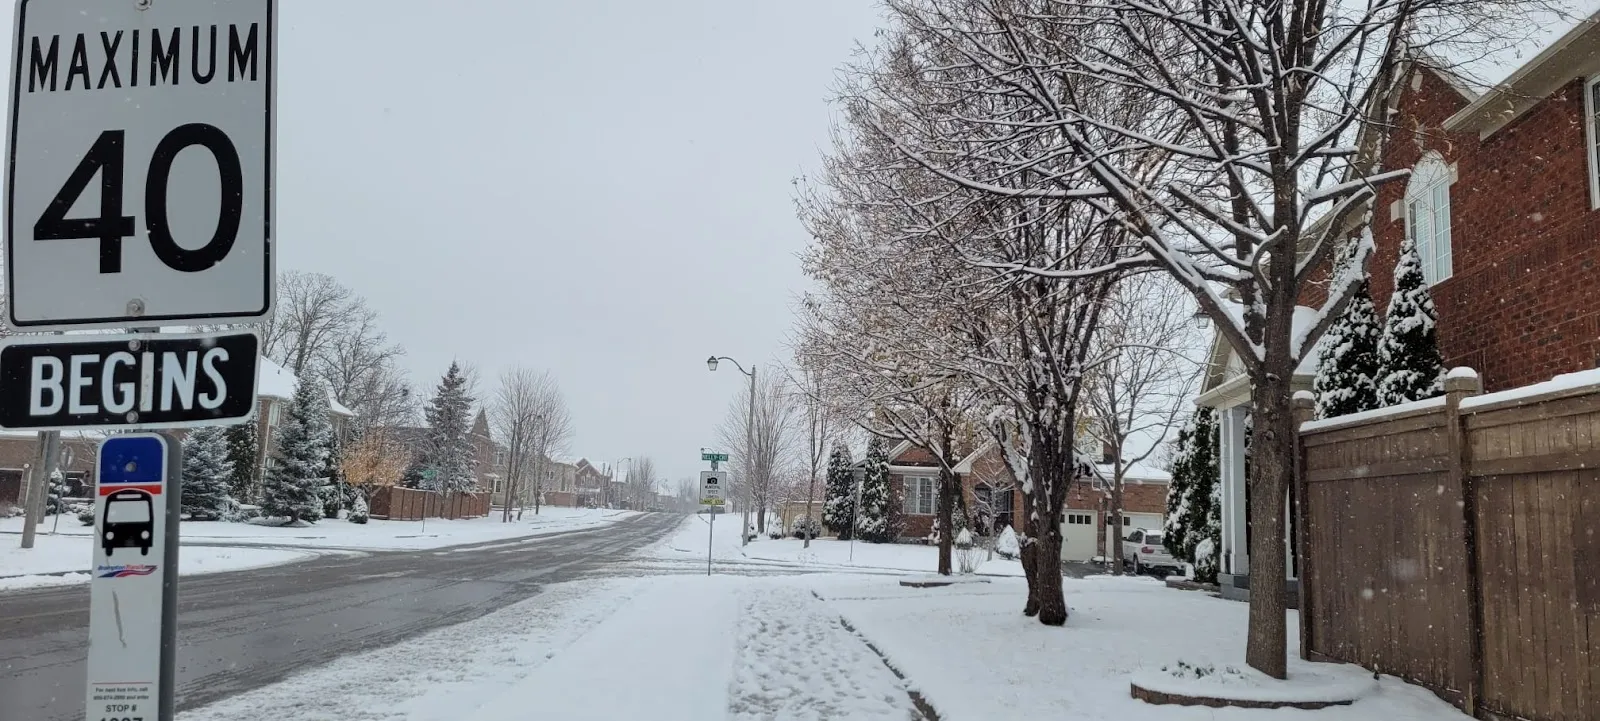
Winter months often see increased traffic delays due to snow and ice, impacting commute times.
Summer festivals and events can lead to temporary road closures, affecting traffic flow.
Commuter Pain Points
Traffic congestion during peak hours remains a major issue for car commuters.
Limited public transport options in certain areas can lead to longer wait times and delays.
Best Travel Times
Commuters are advised to travel before 7 AM or after 7 PM to avoid peak hour congestion.
Midday travel between 11 AM and 2 PM generally experiences lighter traffic.
Event Impacts
Public events, such as concerts and sports games, can cause significant traffic disruptions, especially in downtown areas.
Advance planning and use of public transport are recommended during major events.
Sustainability Efforts
The city is investing in expanding bike lanes and pedestrian pathways to encourage eco-friendly commuting.
Initiatives to increase electric vehicle charging stations are underway to support a greener transportation network.
Ride-Sharing Impact
Ride-sharing services have helped reduce the number of cars on the road, contributing to decreased congestion.
These services offer flexible commuting options, particularly in areas with limited public transport.