Traffic in North Vancouver
In 2024, North Vancouver sees a significant reliance on cars for commuting, with 80% of the population using this mode of transport.Public transportation, primarily buses, accounts for 10% of commutes, highlighting a potential area for growth in sustainable transport options.Average Commute Times
The average commute involves 40 minutes of driving and a total travel time of 49 minutes, covering a distance of approximately 27.4 km.
- Bus - Bus commuters spend about 45 minutes on the bus and an additional 19 minutes waiting and walking, covering a distance of 19.7 km.
- Car - Car commuters drive for about 45 minutes, covering a distance of 28.4 km without significant waiting times.
Traffic Breakdown
Traffic Data
Overall average travel
Average when primarily using Bus
Average when primarily using Car
More Information
Seasonal Trends
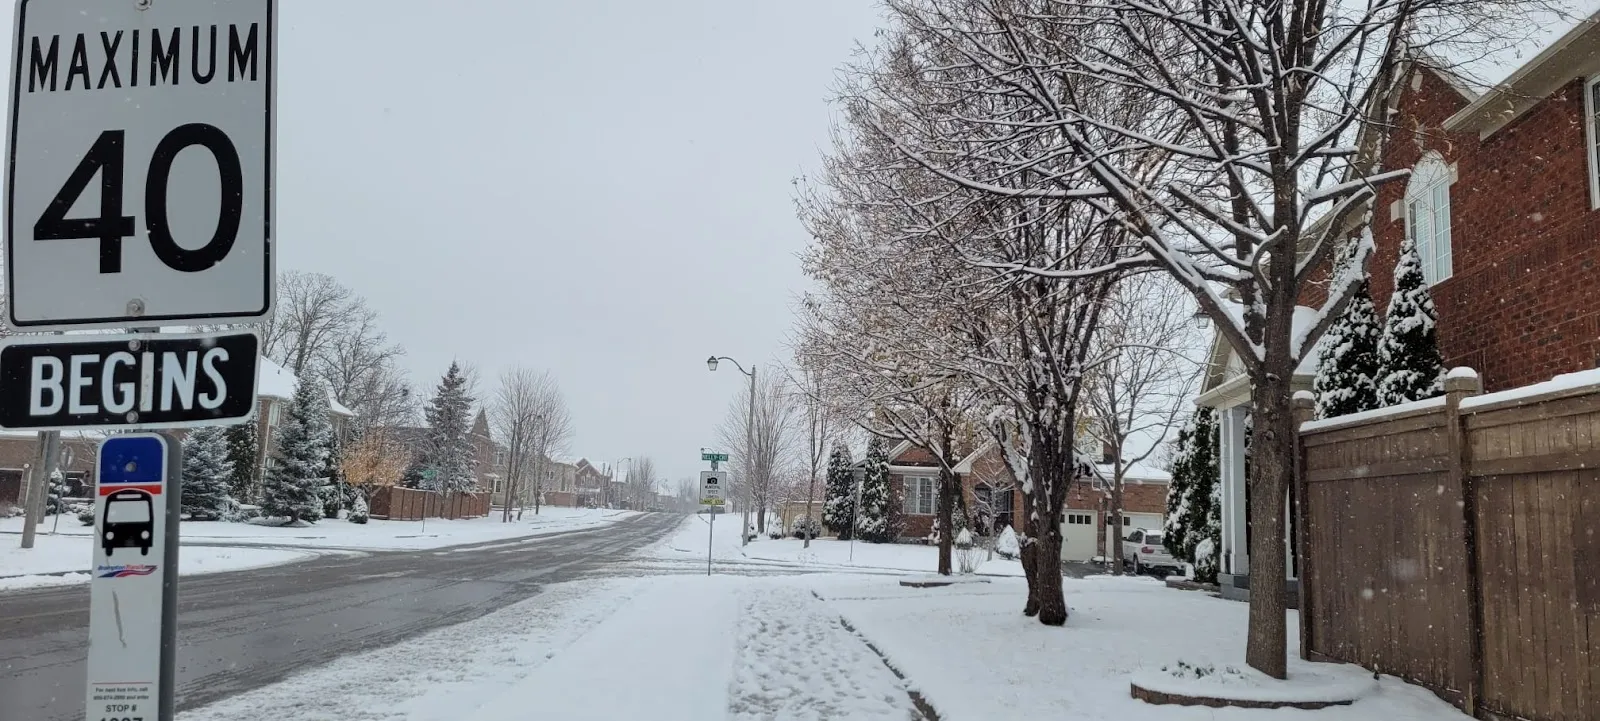
Traffic tends to increase during the winter months due to adverse weather conditions affecting road safety.
Summer months see a slight decrease in traffic as residents take vacations.
Commuter Pain Points
Long waiting times for buses during peak hours.
Traffic congestion on major roads leading to delays.
Best Travel Times
Traveling before 7 AM or after 7 PM can help avoid peak traffic congestion.
Midday travel is generally smoother with less traffic.
Event Impacts
Public events in downtown North Vancouver can lead to significant traffic delays.
Concerts and sports events often result in increased demand for public transport.
Sustainability Efforts
The city is investing in expanding bike lanes to encourage cycling.
Efforts are underway to improve bus frequency and reliability.
Ride-Sharing Impact
Ride-sharing services have helped reduce the number of cars on the road.
These services provide flexible commuting options, especially during off-peak hours.